loss
What does it take to lose something?
Increasingly, our lives are becoming interconnected. As we integrate into a multinational community of nations, commerce, cultures, and online worlds, we gain in social proximity. In popular culture, books like Guns, Germs, and Steel, TV shows like How It's Made, or podcasts such as 99% Invisible attempt to tackle the hidden mechanisms of a world gaining in complexity. Advances in social sciences have led to more conversations about systematic entanglements, and cultural reflections on intractable social systems reflect this shift. It has become more difficult to imagine any one person or place to be an isolate, as local movements, such as the US's Black Lives Matter campaign, ripple out into international contexts, and the smallest of organisms, like a bat-borne flu virus, reveal the deeply intimate nature of our supposed separation. This interconnectivity exerts pressure not only on social structures but also on people as individuals.
When a loss occurs, we are often unprepared. And when it comes to removing something from an interconnected system, it is easy to be overwhelmed. How can we prepare for loss, and how can we work through social change, anticipating the effects of loss and removal? We are increasingly able to recognize systems for what they are, but they remain difficult to capture in their entirety. Moreover, each person experiences these systems differently. This is an open question: how would you think through loss and removal? How would you visualize it, communicate it to others?
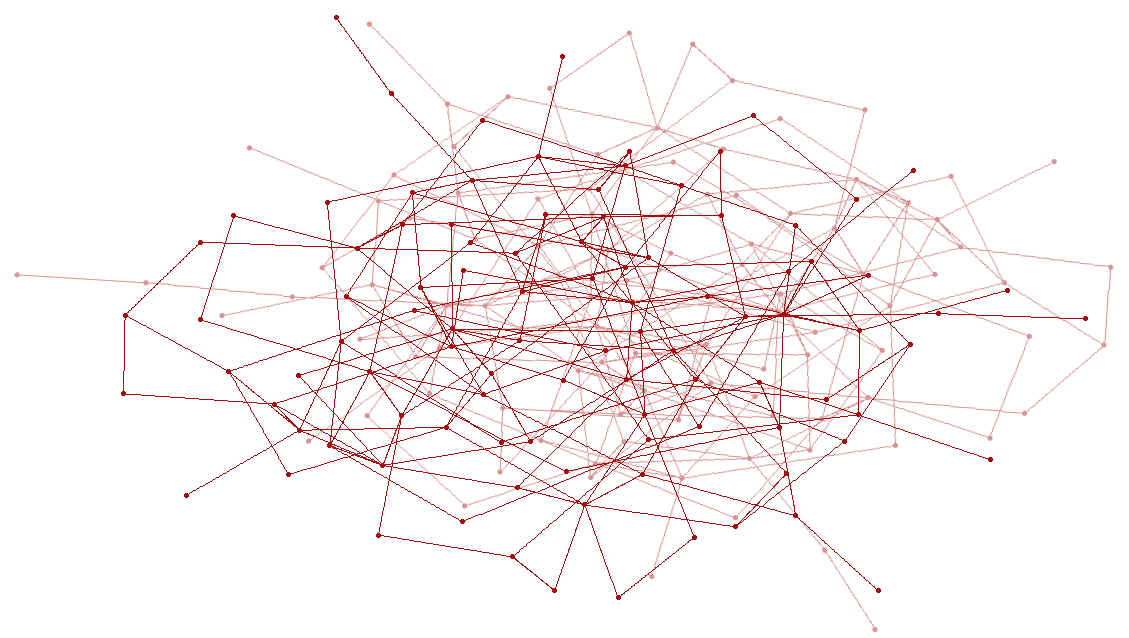
For this project, we're going to think about loss and removal through network visualizations. Visualizations like this have become increasingly popular, showing the relationships between politicians on Twitter or the global resources required to produce an Amazon Echo. However, there is no amount of "big data" that can be visualized to explain the very personal, individual experiences we have with systems and ideas. So instead of using data visualizations for rigorous science, we'll leverage these tools to think through how we are implicated in systems. Below are two examples made using this tool: one examining what it would take to remove meat from my (the designer's) life, and one showing what it would take to remove meat from society (from my limited point of view). If you'd like to make graphs like these, check out the tutorial or just jump right into the tool.